In the College’s Catalogs, a Tale of Wellesley Through Time

“It is a college, arranged for collegiate methods of instruction, and for courses of difficult study such as are pursued in none but the best colleges. It is intended for those students only who desire to give themselves faithfully to the pursuit of knowledge, and to discipline and develop their minds by arduous study.”
These words from Wellesley’s inaugural catalog of 1876–1877 are as true in 2019 as they were at Wellesley’s founding. But since then, the student population at Wellesley has evolved to reflect both a more diverse America and a globalized world.
That first catalog lists one student from India and one from Micronesia. A lone student came from Tennessee, and Colorado and Georgia were represented by a pair of sisters each. Just six students hailed from Texas and California. Students from Massachusetts, meanwhile, were so numerous that the state itself went unlisted in the catalog, which instead mentioned only towns. Nearly all the students were white.
A century later, students were arriving by the dozen from Florida, Hawaii, and Michigan. Others hailed from Arkansas, Arizona, Kentucky, and New Mexico. The 1976–77 catalog lists over 100 international students from countries including Malaysia, Ethiopia, Turkey, and Peru.
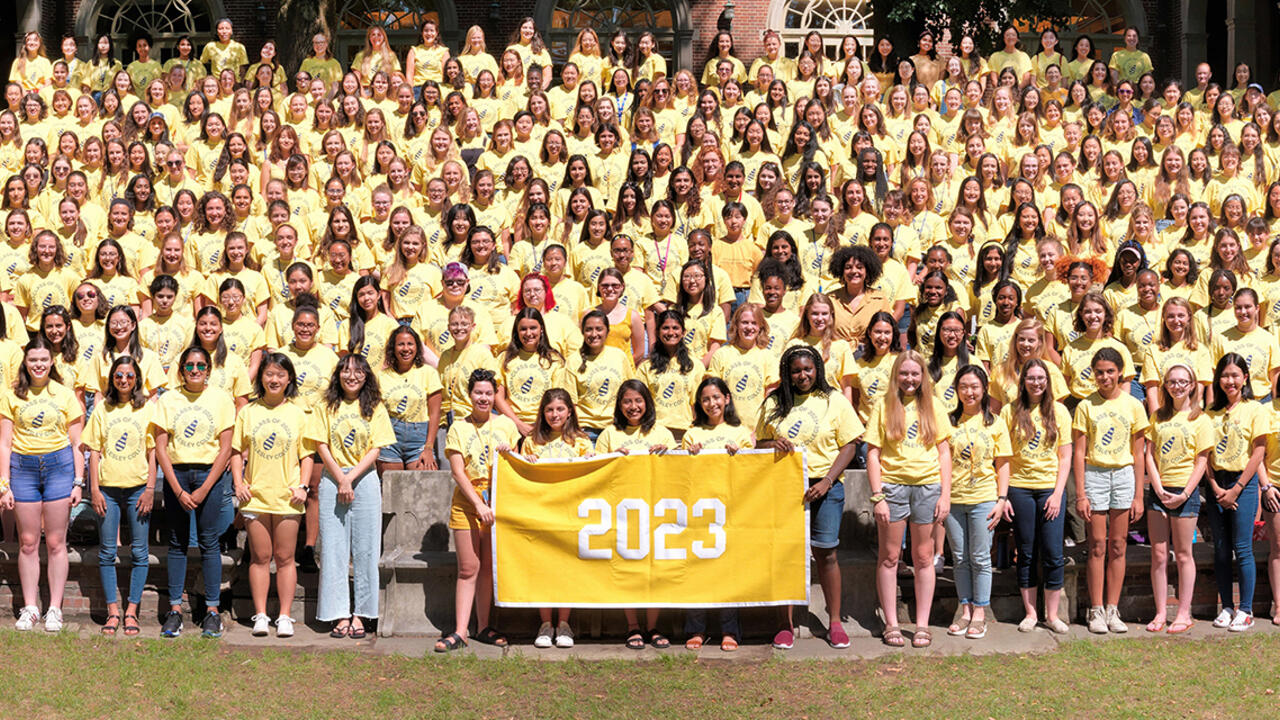
Today, the catalog continues to chart Wellesley’s expanding diversity and its commitment to inclusive excellence. Since 1992, the percentage of international students has nearly doubled. California, once a rarity in Wellesley’s admission rolls, is now the top state represented by the class of 2023, just ahead of Massachusetts; Texas ranks fourth. A majority of the class are domestic students of color, identifying as Asian-American, African-American, Latina or Hispanic, Native American, or multiracial, according to the College’s recently released fall 2019 Admission Report. Wellesley also maintains an annual financial aid budget of $74 million to support students across the socioeconomic spectrum, and meets 100 percent of each admitted student’s calculated need.
These are some of the report’s findings about the class of 2023:
- Eighty percent of the class hails from outside New England.
- Students represent 46 states as well as D.C., Guam, and Puerto Rico.
- International citizens comprise 11 percent of the class and collectively represent 23 nations of citizenship.
- Forty-seven percent grew up in a home where at least one language other than English is spoken.
- Eighteen percent come from families where neither parent has a four-year college degree.
- Fifty-nine percent receive financial aid; the average annual award per student is $50,000.
“Although we’re certainly more diverse now than when Wellesley was founded, we still have a lot of work to do to reflect the current demographics of the country and the world here at Wellesley,” said Joy St. John, Wellesley’s dean of admission and financial aid. “We’re continuously working to improve our admission policies and recruitment strategies to increase access and meet our diversity goals.”
While Wellesley remains “situated on the shore of a beautiful lake,” as described in the inaugural catalog, Wellesley today is vastly more diverse than it was in 1876-77, and the evolution continues today.
“The way I like to frame it is that true excellence really requires equity, inclusion, and intellectual openness, at all levels of learning and in all aspects of our community,” President Paula Johnson said recently. “This is a moment in which the mindset has changed. It’s a moment of viewing this whole initiative around inclusive excellence from a place of strength and a place of positivity, about what our diversity can bring to our community when fully realized.”
Every Wellesley College catalog, dating back to the College’s first for the academic year of 1876-77, can be found here.


